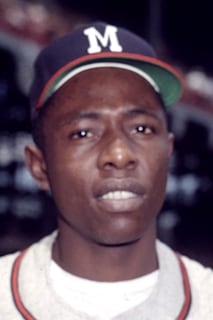
B. J. Upton
Born: 8/21/1984 in Norfolk, VA, USA
MLB Debut: 2004-08-02 | Final Game: 2016-10-02
Bats: R | Throws: R | Height: 6'3" | Weight: 185 lbs
Full name: Melvin Emanuel Upton
Biography
Career Batting Statistics
| G | AB | R | H | 2B | 3B | HR | RBI | SB | BB | SO | AVG | OBP | SLG | OPS | PIV |
|---|---|---|---|---|---|---|---|---|---|---|---|---|---|---|---|
| 1469 | 5175 | 723 | 1260 | 262 | 32 | 164 | 586 | 300 | 589 | 1561 | 0.243 | 0.321 | 0.402 | 0.723 | -1238.7 |
Career AVG .243 vs. league average .259 across their career seasons — 6.1% below league average.
Career OBP .321 vs. league average .326 across their career seasons — near league average.
Career SLG .402 vs. league average .411 across their career seasons — near league average.
Career OPS 0.723 vs. league average 0.736 across their career seasons — near league average.
Season-by-Season Batting
| Year | Team | Lg | G | AB | R | H | 2B | 3B | HR | RBI | SB | BB | SO | AVG | Lg AVG | Lg OBP | Lg SLG | Lg OPS | PIV |
|---|---|---|---|---|---|---|---|---|---|---|---|---|---|---|---|---|---|---|---|
| 2004 | TBR | AL | 45 | 159 | 19 | 41 | 8 | 2 | 4 | 12 | 4 | 15 | 46 | 0.258 | .266 (-3%) | .335 (-3%) | .427 (-4%) | .762 (-4%) | -124.2 |
| 2006 | TBR | AL | 50 | 175 | 20 | 43 | 5 | 0 | 1 | 10 | 11 | 13 | 40 | 0.246 | .269 (-9%) | .336 (-10%) | .431 (-33%) | .768 (-23%) | -690.8 |
| 2007 | TBR | AL | 129 | 474 | 86 | 142 | 25 | 1 | 24 | 82 | 22 | 65 | 154 | 0.300 | .268 (+12%) | .335 (+15%) | .422 (+20%) | .758 (+18%) | 1880.0 |
| 2008 | TBR | AL | 145 | 531 | 85 | 145 | 37 | 2 | 9 | 67 | 44 | 97 | 134 | 0.273 | .263 (+4%) | .333 (+15%) | .416 (-4%) | .749 (+5%) | 829.3 |
| 2009 | TBR | AL | 144 | 560 | 79 | 135 | 33 | 4 | 11 | 55 | 42 | 57 | 152 | 0.241 | .262 (-8%) | .332 (-6%) | .417 (-11%) | .750 (-9%) | -1015.7 |
| 2010 | TBR | AL | 154 | 536 | 89 | 127 | 38 | 4 | 18 | 62 | 42 | 67 | 164 | 0.237 | .257 (-8%) | .325 (-1%) | .402 (+5%) | .728 (+2%) | 215.9 |
| 2011 | TBR | AL | 153 | 560 | 82 | 136 | 27 | 4 | 23 | 81 | 36 | 71 | 161 | 0.243 | .255 (-5%) | .320 (+3%) | .399 (+7%) | .719 (+6%) | 691.6 |
| 2012 | TBR | AL | 146 | 573 | 79 | 141 | 29 | 3 | 28 | 78 | 31 | 45 | 169 | 0.246 | .254 (-3%) | .318 (-6%) | .405 (+12%) | .724 (+4%) | 232.6 |
| 2013 | ATL | NL | 126 | 391 | 30 | 72 | 14 | 0 | 9 | 26 | 12 | 44 | 151 | 0.184 | .253 (-27%) | .317 (-16%) | .396 (-27%) | .714 (-22%) | -1666.0 |
| 2014 | ATL | NL | 141 | 519 | 67 | 108 | 19 | 5 | 12 | 35 | 20 | 57 | 173 | 0.208 | .251 (-17%) | .313 (-9%) | .386 (-14%) | .700 (-11%) | -1126.4 |
| 2015 | SDP | NL | 87 | 205 | 23 | 53 | 12 | 4 | 5 | 17 | 9 | 21 | 62 | 0.259 | .254 (+2%) | .316 (+3%) | .404 (+6%) | .721 (+5%) | 175.9 |
| 2016 | SDP | NL | 92 | 344 | 46 | 88 | 11 | 2 | 16 | 45 | 20 | 23 | 106 | 0.256 | .255 (avg) | .321 (-6%) | .417 (+5%) | .738 (+1%) | -31.0 |
| 2016 | TOR | AL | 57 | 148 | 18 | 29 | 4 | 1 | 4 | 16 | 7 | 14 | 49 | 0.196 | .255 (-23%) | .321 (-19%) | .417 (-24%) | .738 (-22%) | -31.0 |
Postseason Statistics
Playoff Career Batting
Playoff Batting by Year
| Year | Round | Team | G | AB | R | H | 2B | 3B | HR | RBI | BB | SO | AVG |
|---|---|---|---|---|---|---|---|---|---|---|---|---|---|
| 2016 | ALCS | TOR | 5 | 4 | 0 | 0 | 0 | 0 | 0 | 0 | 0 | 4 | 0.000 |
| 2016 | ALDS1 | TOR | 3 | 6 | 1 | 2 | 1 | 0 | 1 | 1 | 1 | 1 | 0.333 |
| 2016 | ALWC | TOR | 1 | 1 | 0 | 0 | 0 | 0 | 0 | 0 | 0 | 0 | 0.000 |
| 2013 | NLDS2 | ATL | 3 | 3 | 1 | 0 | 0 | 0 | 0 | 0 | 0 | 3 | 0.000 |
| 2011 | ALDS2 | TBA | 4 | 14 | 3 | 4 | 3 | 0 | 0 | 0 | 4 | 6 | 0.286 |
| 2010 | ALDS1 | TBA | 5 | 21 | 0 | 4 | 2 | 0 | 0 | 2 | 0 | 7 | 0.190 |
| 2008 | ALCS | TBA | 7 | 28 | 8 | 9 | 1 | 0 | 4 | 11 | 4 | 7 | 0.321 |
| 2008 | ALDS2 | TBA | 4 | 18 | 5 | 5 | 0 | 1 | 3 | 4 | 1 | 5 | 0.278 |
| 2008 | WS | TBA | 5 | 20 | 3 | 5 | 0 | 0 | 0 | 1 | 0 | 4 | 0.250 |
Fielding Statistics
Career Fielding Totals by Position
| Position | G | GS | PO | A | E | DP |
|---|---|---|---|---|---|---|
| 2B | 48 | 48 | 106 | 133 | 12 | 26 |
| 3B | 63 | 59 | 48 | 100 | 15 | 6 |
| OF | 1278 | 1218 | 2941 | 79 | 39 | 23 |
| SS | 16 | 16 | 23 | 41 | 7 | 8 |
Season-by-Season Fielding
| Year | Team | Pos | G | GS | PO | A | E | DP |
|---|---|---|---|---|---|---|---|---|
| 2004 | TBA | 3B | 13 | 11 | 10 | 12 | 2 | 0 |
| 2004 | TBA | OF | 1 | 1 | 0 | 0 | 0 | 0 |
| 2004 | TBA | SS | 16 | 16 | 23 | 41 | 7 | 8 |
| 2006 | TBA | 3B | 50 | 48 | 38 | 88 | 13 | 6 |
| 2007 | TBA | 2B | 48 | 48 | 106 | 133 | 12 | 26 |
| 2007 | TBA | OF | 78 | 75 | 204 | 11 | 2 | 2 |
| 2008 | TBA | OF | 143 | 141 | 378 | 16 | 7 | 5 |
| 2009 | TBA | OF | 144 | 141 | 375 | 6 | 4 | 1 |
| 2010 | TBA | OF | 154 | 147 | 397 | 3 | 5 | 0 |
| 2011 | TBA | OF | 151 | 150 | 382 | 6 | 3 | 3 |
| 2012 | TBA | OF | 142 | 141 | 290 | 10 | 3 | 4 |
| 2013 | ATL | OF | 118 | 111 | 230 | 3 | 4 | 3 |
| 2014 | ATL | OF | 139 | 135 | 329 | 9 | 7 | 3 |
| 2015 | SDN | OF | 63 | 47 | 116 | 6 | 1 | 0 |
| 2016 | SDN | OF | 90 | 88 | 165 | 8 | 2 | 2 |
| 2016 | TOR | OF | 55 | 41 | 75 | 1 | 1 | 0 |
Career Games by Position
| Position | Games |
|---|---|
| Second Base | 48 |
| Third Base | 63 |
| Shortstop | 16 |
| Left Field | 122 |
| Center Field | 1159 |
| Right Field | 3 |
| Designated Hitter | 23 |
Awards & Honors
| Year | Award | Notes |
|---|---|---|
| 2012 | Player of the Week | Week of 2012-09-09 |
| 2009 | Player of the Month | June |
| 2009 | Player of the Week | Week of 2009-06-20 |
| 2007 | Player of the Week | Week of 2007-07-21 |
Salary History
| Year | Team | League | Salary |
|---|---|---|---|
| 2016 | SDN | NL | $15,450,000 |
| 2015 | SDN | NL | $14,450,000 |
| 2014 | ATL | NL | $13,450,000 |
| 2013 | ATL | NL | $13,050,000 |
| 2012 | TBA | AL | $7,000,000 |
| 2011 | TBA | AL | $4,825,000 |
| 2010 | TBA | AL | $3,000,000 |
| 2009 | TBA | AL | $435,000 |
| 2008 | TBA | AL | $412,100 |
| 2007 | TBA | AL | $386,900 |
| Total Career Earnings | $72,459,000 | ||