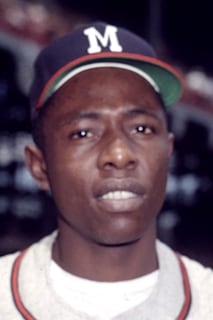
Pat Burrell
Born: 10/10/1976 in Eureka Springs, AR, USA
MLB Debut: 2000-05-24 | Final Game: 2011-09-28
Bats: R | Throws: R | Height: 6'4" | Weight: 235 lbs
Full name: Patrick Brian Burrell
Biography
Career Batting Statistics
| G | AB | R | H | 2B | 3B | HR | RBI | SB | BB | SO | AVG | OBP | SLG | OPS | PIV |
|---|---|---|---|---|---|---|---|---|---|---|---|---|---|---|---|
| 1640 | 5503 | 767 | 1393 | 299 | 16 | 292 | 976 | 7 | 932 | 1564 | 0.253 | 0.361 | 0.472 | 0.834 | 13772.8 |
Career AVG .253 vs. league average .264 across their career seasons — near league average.
Career OBP .361 vs. league average .333 across their career seasons — +8.6% above league average.
Career SLG .472 vs. league average .420 across their career seasons — +12.5% above league average.
Career OPS 0.834 vs. league average 0.753 across their career seasons — +10.8% above league average.
Season-by-Season Batting
| Year | Team | Lg | G | AB | R | H | 2B | 3B | HR | RBI | SB | BB | SO | AVG | Lg AVG | Lg OBP | Lg SLG | Lg OPS | PIV |
|---|---|---|---|---|---|---|---|---|---|---|---|---|---|---|---|---|---|---|---|
| 2000 | PHI | NL | 111 | 408 | 57 | 106 | 27 | 1 | 18 | 79 | 0 | 63 | 139 | 0.260 | .270 (-4%) | .344 (+4%) | .437 (+6%) | .782 (+5%) | 487.7 |
| 2001 | PHI | NL | 155 | 539 | 70 | 139 | 29 | 2 | 27 | 89 | 2 | 70 | 162 | 0.258 | .263 (-2%) | .332 (+4%) | .426 (+10%) | .758 (+7%) | 917.5 |
| 2002 | PHI | NL | 157 | 586 | 96 | 165 | 39 | 2 | 37 | 116 | 1 | 89 | 153 | 0.282 | .261 (+8%) | .331 (+13%) | .416 (+31%) | .747 (+23%) | 2924.3 |
| 2003 | PHI | NL | 146 | 522 | 57 | 109 | 31 | 4 | 21 | 64 | 0 | 72 | 142 | 0.209 | .264 (-21%) | .332 (-7%) | .422 (-4%) | .754 (-6%) | -603.0 |
| 2004 | PHI | NL | 127 | 448 | 66 | 115 | 17 | 0 | 24 | 84 | 2 | 78 | 130 | 0.257 | .266 (-4%) | .335 (+9%) | .427 (+6%) | .762 (+8%) | 860.9 |
| 2005 | PHI | NL | 154 | 562 | 78 | 158 | 27 | 1 | 32 | 117 | 0 | 99 | 160 | 0.281 | .264 (+6%) | .330 (+18%) | .418 (+20%) | .749 (+19%) | 2557.1 |
| 2006 | PHI | NL | 144 | 462 | 80 | 119 | 24 | 1 | 29 | 95 | 0 | 98 | 131 | 0.258 | .269 (-4%) | .336 (+15%) | .431 (+16%) | .768 (+16%) | 1842.7 |
| 2007 | PHI | NL | 155 | 472 | 77 | 121 | 26 | 0 | 30 | 97 | 0 | 114 | 120 | 0.256 | .268 (-4%) | .335 (+19%) | .422 (+19%) | .758 (+19%) | 2297.5 |
| 2008 | PHI | NL | 157 | 536 | 74 | 134 | 33 | 3 | 33 | 86 | 0 | 102 | 136 | 0.250 | .263 (-5%) | .333 (+10%) | .416 (+22%) | .749 (+17%) | 2036.0 |
| 2009 | TBR | AL | 122 | 412 | 45 | 91 | 16 | 1 | 14 | 64 | 2 | 57 | 119 | 0.221 | .262 (-16%) | .332 (-5%) | .417 (-12%) | .750 (-9%) | -727.7 |
| 2010 | TBR | AL | 24 | 84 | 9 | 17 | 5 | 0 | 2 | 13 | 0 | 10 | 28 | 0.202 | .257 (-21%) | .325 (-10%) | .402 (-17%) | .728 (-14%) | -199.1 |
| 2010 | SFG | NL | 96 | 289 | 41 | 77 | 16 | 0 | 18 | 51 | 0 | 47 | 77 | 0.266 | .257 (+4%) | .325 (+12%) | .402 (+26%) | .728 (+20%) | -199.1 |
| 2011 | SFG | NL | 92 | 183 | 17 | 42 | 9 | 1 | 7 | 21 | 0 | 33 | 67 | 0.230 | .255 (-10%) | .320 (+10%) | .399 (+1%) | .719 (+5%) | 266.8 |
Postseason Statistics
Playoff Career Batting
Playoff Batting by Year
| Year | Round | Team | G | AB | R | H | 2B | 3B | HR | RBI | BB | SO | AVG |
|---|---|---|---|---|---|---|---|---|---|---|---|---|---|
| 2010 | NLCS | SFN | 6 | 19 | 3 | 4 | 2 | 0 | 0 | 1 | 3 | 7 | 0.211 |
| 2010 | NLDS2 | SFN | 4 | 10 | 1 | 2 | 1 | 0 | 1 | 3 | 2 | 4 | 0.200 |
| 2010 | WS | SFN | 4 | 13 | 1 | 0 | 0 | 0 | 0 | 0 | 2 | 11 | 0.000 |
| 2008 | NLCS | PHI | 5 | 18 | 1 | 6 | 0 | 0 | 1 | 3 | 1 | 7 | 0.333 |
| 2008 | NLDS2 | PHI | 4 | 12 | 2 | 3 | 0 | 0 | 2 | 4 | 2 | 1 | 0.250 |
| 2008 | WS | PHI | 5 | 14 | 0 | 1 | 1 | 0 | 0 | 1 | 5 | 5 | 0.071 |
| 2007 | NLDS2 | PHI | 3 | 11 | 1 | 2 | 0 | 0 | 1 | 1 | 2 | 3 | 0.182 |
Fielding Statistics
Career Fielding Totals by Position
| Position | G | GS | PO | A | E | DP |
|---|---|---|---|---|---|---|
| 1B | 58 | 58 | 460 | 22 | 6 | 37 |
| OF | 1328 | 1312 | 2018 | 92 | 53 | 11 |
Season-by-Season Fielding
| Year | Team | Pos | G | GS | PO | A | E | DP |
|---|---|---|---|---|---|---|---|---|
| 2000 | PHI | 1B | 58 | 58 | 460 | 22 | 6 | 37 |
| 2000 | PHI | OF | 48 | 48 | 74 | 6 | 2 | 0 |
| 2001 | PHI | OF | 146 | 143 | 226 | 18 | 7 | 2 |
| 2002 | PHI | OF | 157 | 154 | 273 | 8 | 6 | 1 |
| 2003 | PHI | OF | 140 | 138 | 234 | 7 | 6 | 0 |
| 2004 | PHI | OF | 122 | 121 | 217 | 9 | 4 | 1 |
| 2005 | PHI | OF | 153 | 153 | 236 | 10 | 7 | 2 |
| 2006 | PHI | OF | 126 | 126 | 204 | 8 | 3 | 1 |
| 2007 | PHI | OF | 138 | 138 | 176 | 8 | 10 | 2 |
| 2008 | PHI | OF | 155 | 154 | 202 | 12 | 2 | 1 |
| 2009 | TBA | OF | 2 | 1 | 2 | 0 | 0 | 0 |
| 2010 | SFN | OF | 87 | 86 | 121 | 4 | 2 | 0 |
| 2011 | SFN | OF | 54 | 50 | 53 | 2 | 4 | 1 |
Career Games by Position
| Position | Games |
|---|---|
| First Base | 58 |
| Left Field | 1327 |
| Right Field | 1 |
| Designated Hitter | 160 |
Awards & Honors
| Year | Award | Notes |
|---|---|---|
| 2005 | Player of the Week | Week of 2005-04-09 |
| 2005 | Player of the Week | Week of 2005-05-21 |
Salary History
| Year | Team | League | Salary |
|---|---|---|---|
| 2011 | SFN | NL | $1,000,000 |
| 2010 | TBA | AL | $9,000,000 |
| 2009 | TBA | AL | $7,000,000 |
| 2008 | PHI | NL | $14,250,000 |
| 2007 | PHI | NL | $13,250,000 |
| 2006 | PHI | NL | $9,750,000 |
| 2005 | PHI | NL | $7,250,000 |
| 2004 | PHI | NL | $4,250,000 |
| 2003 | PHI | NL | $1,250,000 |
| 2002 | PHI | NL | $1,905,000 |
| 2001 | PHI | NL | $1,905,000 |
| Total Career Earnings | $70,810,000 | ||
College History
| School Name | City | State | Years Attended |
|---|---|---|---|
| University of Miami | Coral Gables | FL | 1996, 1997, 1998 |
Award Voting History
| Year | Award | League | Finish | Points Won | Points Max | Votes First |
|---|---|---|---|---|---|---|
| 2005 | Most Valuable Player | NL | 7th | 65.0 | 448 | 0 |
| 2002 | Most Valuable Player | NL | 14th | 8.0 | 448 | 0 |
| 2000 | Rookie of the Year | NL | 4th | 10.0 | 160 | 0 |